
◆ Quickly obtain the color X-ray surface distribution through simple operation
◆ Move to the designated location, and the spectrum can be confirmed in real time
Dual screen display
You only need to select images and templates, and you can display point analysis and line analysis results in real time while generating Word®, Excel®, and surface distribution information.
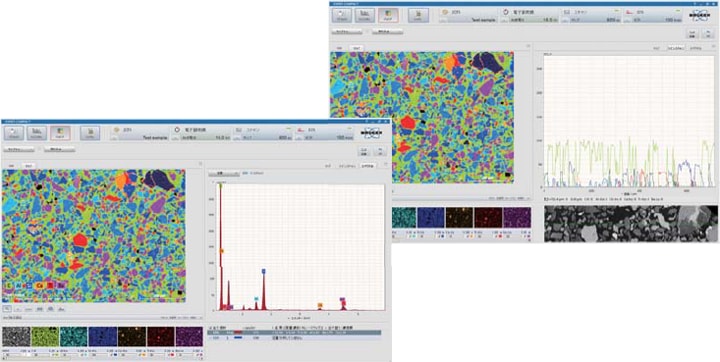
◆ Ultra-high performance (hyper map) makes it possible to obtain point analysis, line analysis, and surface distribution results in one test
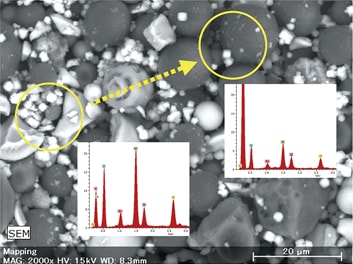
Point analysis
The spectrum can be tracked in real time according to the position of the point, and the target element can be easily confirmed.
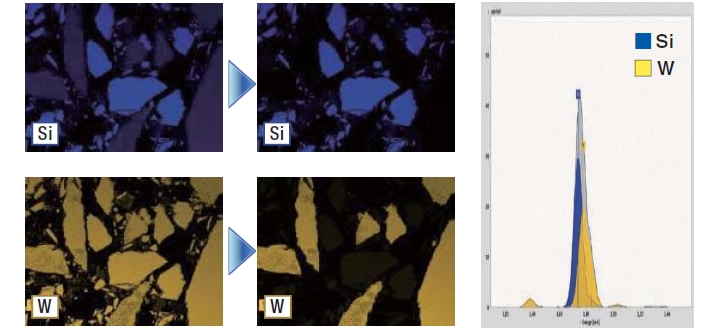
Real-time online spectral peak peeling surface distribution
Separate the overlapping elements of spectral peaks in the conventional surface distribution image, and display the correct results.